12.2. Action Examples
12.2.1. Trace Route
This action traces the route and measures the transit delays of packets at the same time.
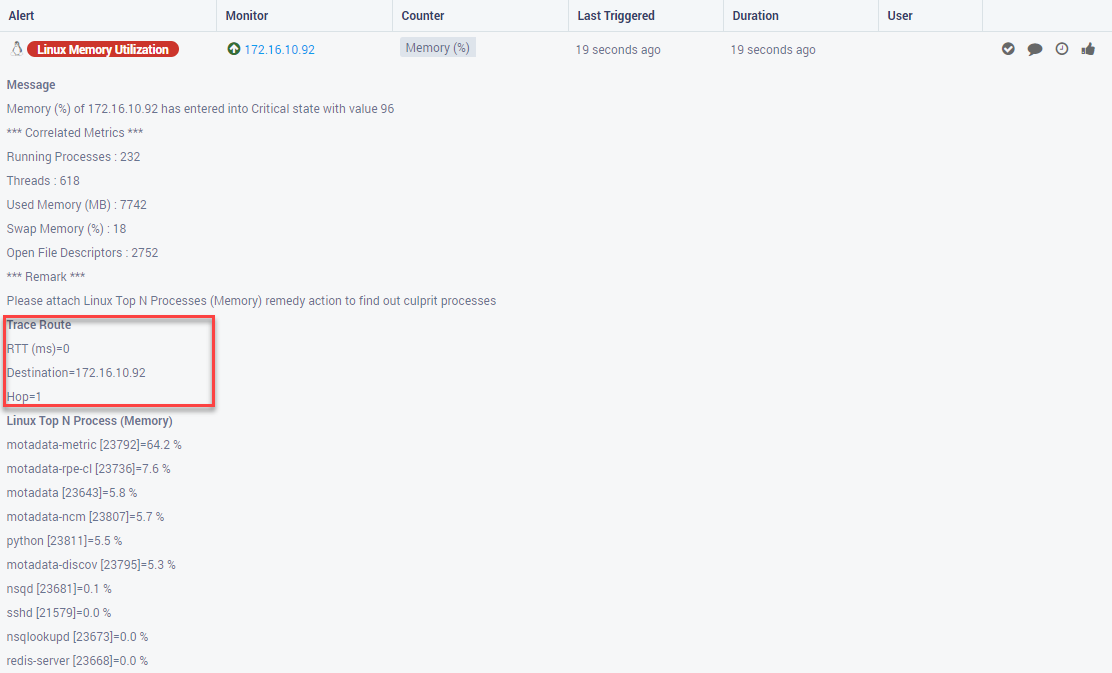
Trace Route Information when Threshold is Violated
12.2.2. UI Alert
The alerts are displayed on the UI whenever the threshold is reached. The color of the alerts dictates the nature of the alert. See the alerts in admin section for color coding.
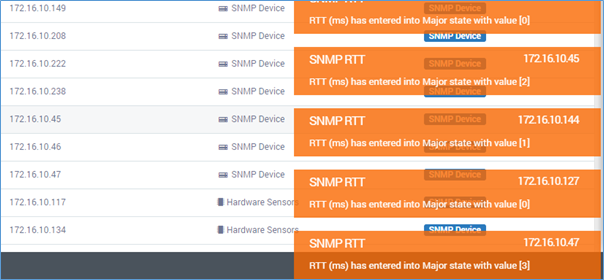
UI Alert with Color Code based on Alert Type
12.2.3. Windows Top N Processes (Memory)
Note: This Action is used for only windows monitors.
This action shows windows processes that are consuming maximum memory [Figure shows top 10 processes]. You can see the geeky details here.
Restrict No. of Alerts: You can control the number of alerts to be sent globally (keep sending the alerts until the severity is changed. Or send only specified number of alerts even if critical state is not changed) when violation occurs.
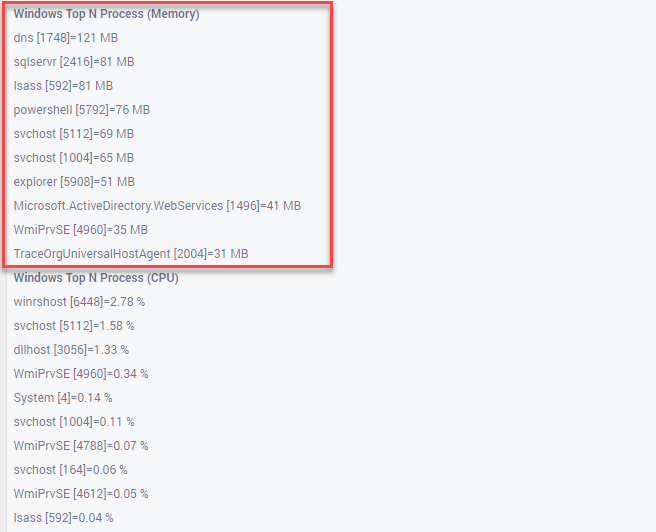
Top 5 Processes with Maximum Memory
12.2.4. Windows Top N Processes (CPU)
Note: This Action is used for only windows monitors.
This action shows windows processes that are utilizing maximum CPU [Figure shows top 10 processes]. You can see the geeky details here.
Restrict No. of Alerts: You can control the number of alerts to be sent globally (keep sending the alerts until the severity is changed. Or send only specified number of alerts even if critical state is not changed) when violation occurs.
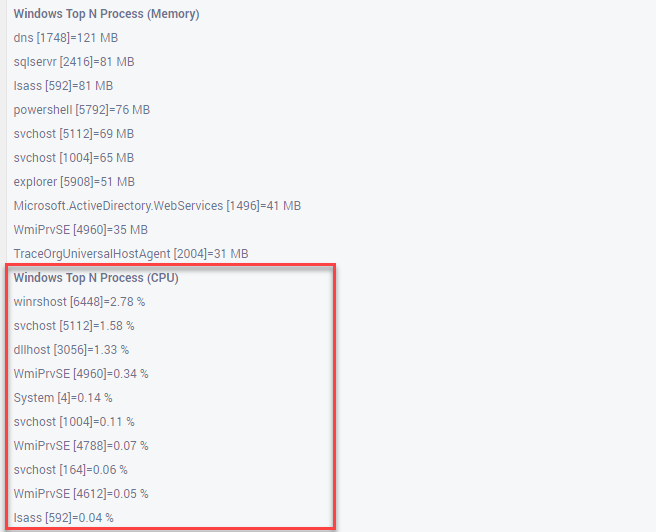
Top 10 Processes with Maximum CPU
12.2.5. SMS Alert(s)
This feature allows you to deliver alerts and notifications to mobile devices in addition to standard email notifications. The system will create the SMS alert profile and display a confirmation message of the action. You can assign this alert profile to policies. Motadata will send an SMS with the message specified by you to the target user.
12.2.6. Slack Alert
This feature allows you to deliver alerts and notifications to third Party application such as Slack. The system will create the SMS alert profile and display a confirmation message of the action. You can assign this alert profile to policies. Motadata will send an alert notification with the Monitor details to the configured and target channel.
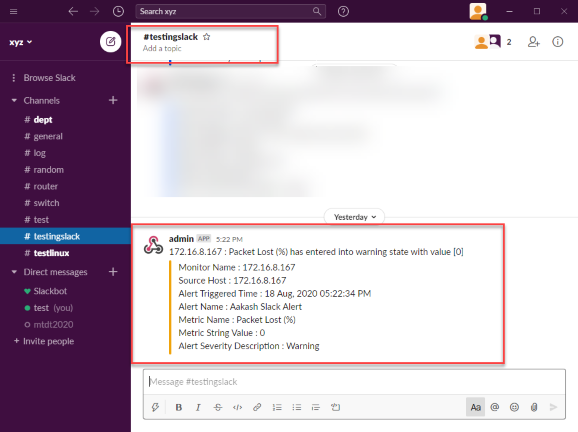
Slack Alert
Note
The slack alert will be notified in the mentioned channel only. While configuration of alert, channel name needs to be specified correctly.
12.2.7. Email Alert(s)
When a threshold is violated in network, create email alert profiles to notify a user(s) by adding them in performance policies. To notify a user, provide its email address. You can configure alert to send email messages to multiple recipients.
Note
Leave message subject and body blank to receive the default message generated by system. Or customize the message in alerts page using the listed placeholders there.
Mail Server under admin panel must be configured before to create Email Alerts.
Restrict No. of Alerts: Restrict No. of Alerts: You can control the number of alerts to be sent globally (keep sending the alerts until the severity is changed. Or send only specified number of alerts even if critical state is not changed) when violation occurs.
12.2.8. Linux Top N Processes (Memory)
Note: This Action is used for only linux monitors.
This action shows linux processes that are consuming maximum memory [Figure shows top 10 processes]. You can see the geeky details here.
Restrict No. of Alerts: You can control the number of alerts to be sent globally (keep sending the alerts until the severity is changed. Or send only specified number of alerts even if critical state is not changed) when violation occurs.
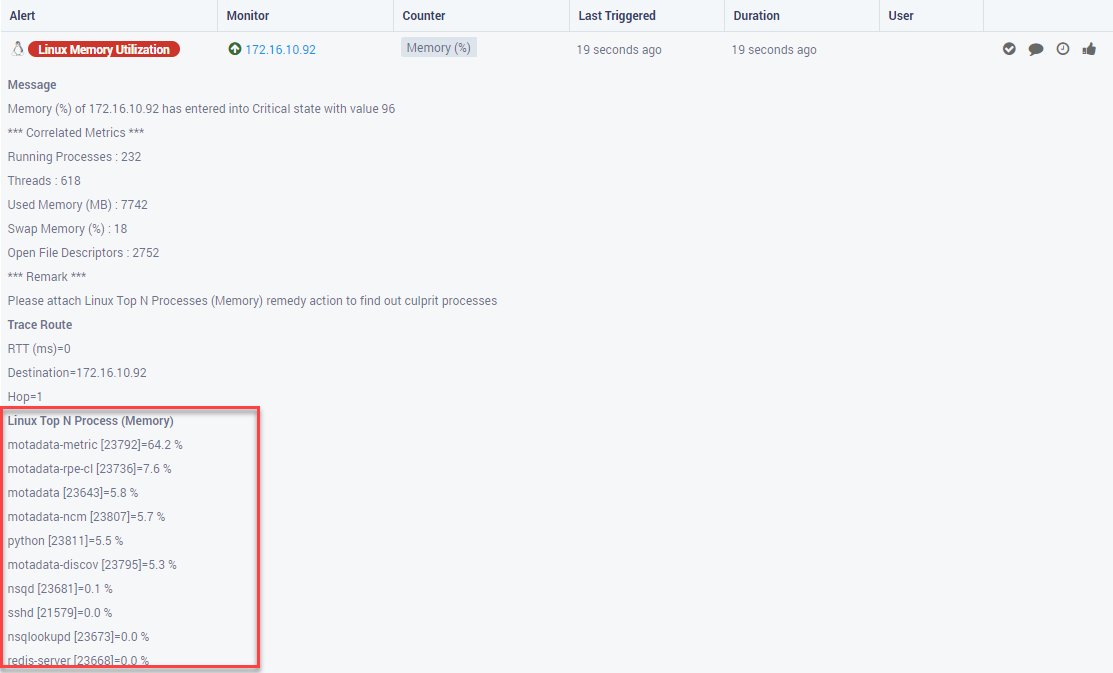
Top N Processes of Linux Memory
12.2.9. Flotomate Trouble Ticket
Motadata supports integration with ticketing tool and generate tickets for alerts. You can configure system to create tickets automatically. Motadata communicates with ticketing tool to send the Alert status, update the alert status and show the ticket information from tool in Motadata screen.
Motadata uses API based communication so you can use your ticketing tool. If you do not have one, we recommend Flotomate or ServiceOps. Motadata is tested thoroughly with this tool.
12.2.9.1. Workflow
Configure Alerts to generate it manually. The ticket will be created in your ticketing tool showing you the current alert status and other necessary information.
When the status of monitor will change, Motadata will update the alert status in the ticket.
Someone will look at the ticket and make necessary changes to bring monitor in the clear state.
When monitor is in clear state, Motadata will close the ticket automatically. Please do not close ticket manually from ITSM tool.
When the monitor is again in alert state, a new ticket is opened in ticketing tool.
Motadata will not close the ticket when you clear the alert manually (from alert stream). The ticket is closed only when monitor is in clear state (see point 4).
12.2.9.2. Prerequisites
Ask your service agent to install the ticketing application in your Motadata server. This will require to restart Motadata server a couple of times, so act accordingly.
12.2.9.3. Configuring the Tool
You need to create an action – Trouble Ticketing first. With this action you store the ticketing tool’s configuration settings in Motadata server. To create this action:
Go to Actions > + New
In Actions dropdown, select ‘Trouble Ticket’.
Fill all the details.
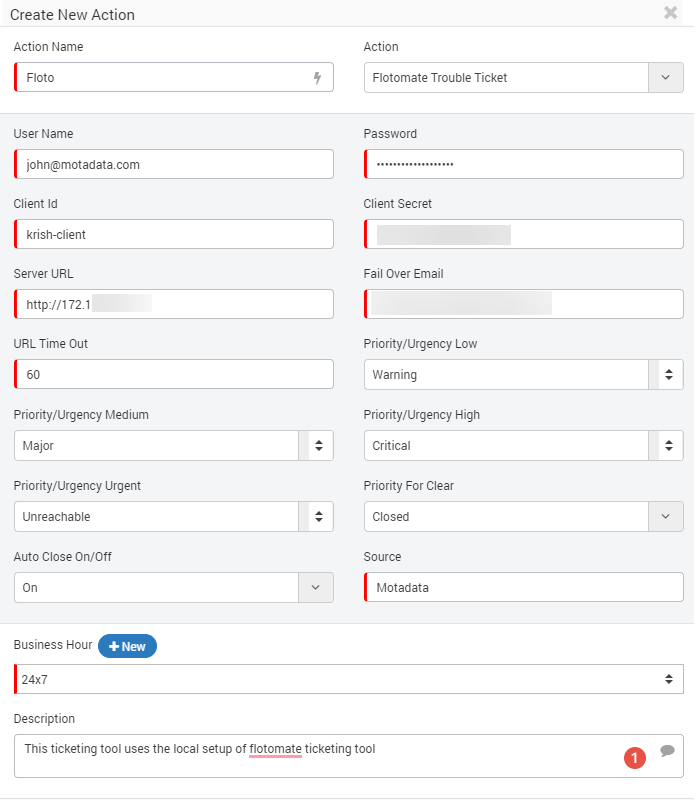
Create Flotomate Trouble Ticket Screen (with Sample Data)
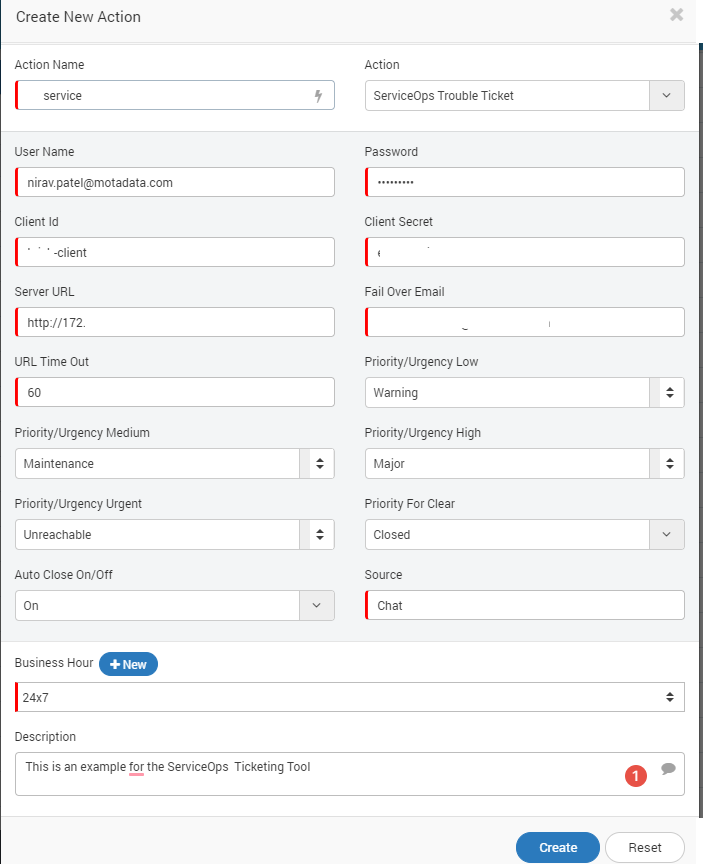
Create ServiceOps Trouble Ticket Screen (with Sample Data)
The field names have standard meanings. If you don’t know what you need to fill, simply google and you should find a solution. Else, talk to the Motadata expert. Use this action and add to the alerts. See Alert Options for using trouble ticketing.
12.2.10. Linux Top N Processes (CPU)
Note: This Action is used for only linux monitors.
This action shows linux processes that are utilizing maximum CPU [Figure shows top 10 processes]. You can see the geeky details here.
Restrict No. of Alerts: You can control the number of alerts to be sent globally (keep sending the alerts until the severity is changed. Or send only specified number of alerts even if critical state is not changed) when violation occurs.
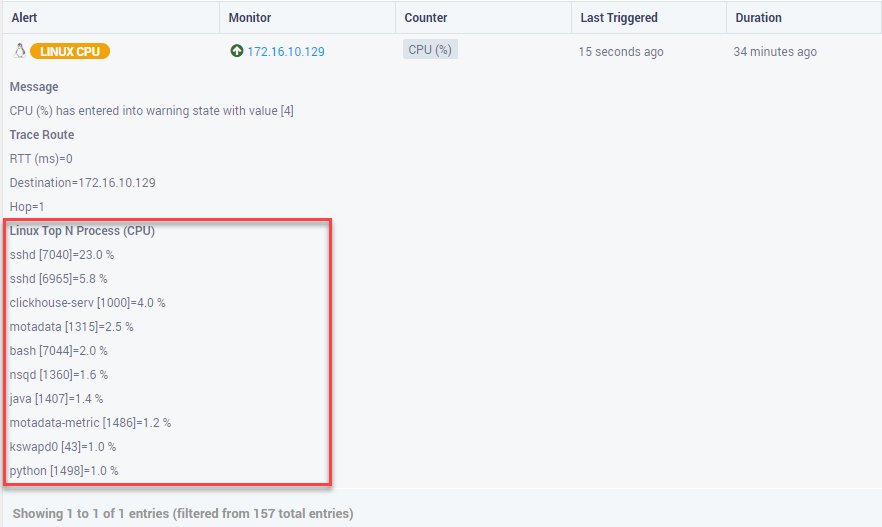
Top N Processes of Linux CPU
12.2.11. SSH Script Action
This action allows you to create custom scripts to perform some actions in the monitor. When an alert is triggered, Motadata runs the script associated with it. This script is nothing but the commands that you would manually run at the monitor’s terminal. It is highly recommended to use this action only in Expert Supervision.
For example: When a monitor (say: Linux) has memory issues. You can create a script to clear some cache memory.
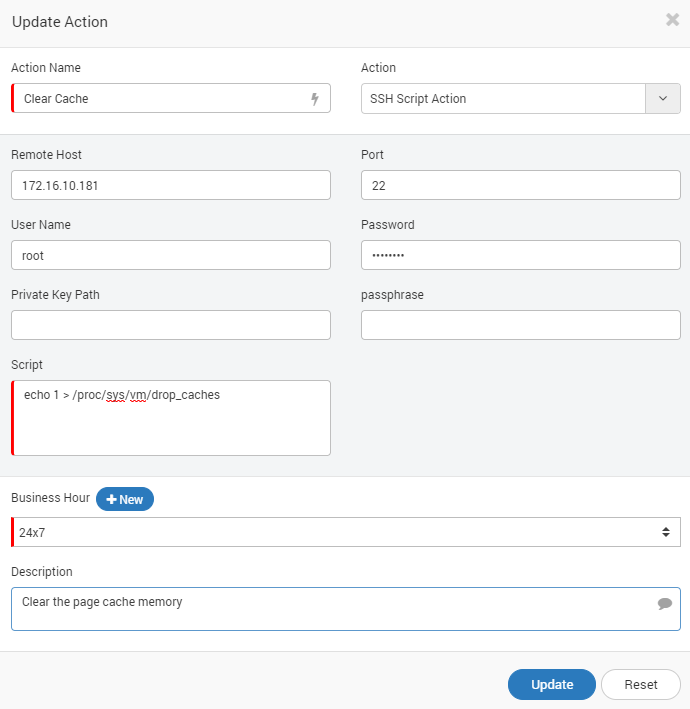
SSH Script to Optimize Memory in a Monitor
You can verify the status of the script form alerts stream menu. It tells you about which script is executed in the monitor.
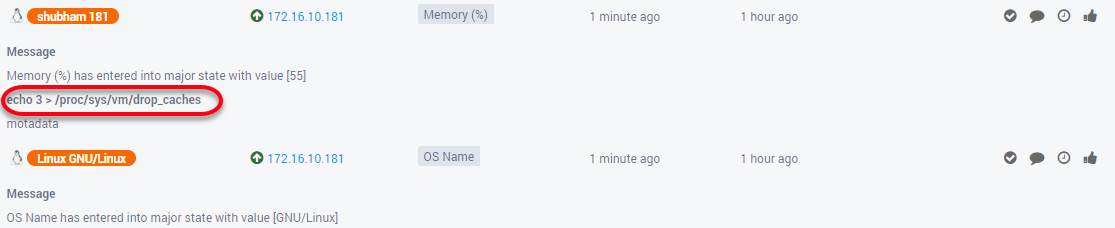
SSH Script